Key points
– Starting point valuations – like yields and price to earnings ratios – are key drivers of medium-term investment returns.
– For growth assets it’s often more complicated, with the level of interest rates playing a big role.
– At present, valuation starting points for term deposits and bonds have improved. For shares they suggest constrained return potential from US shares but are better for Australia.
Introduction
It’s logical that the cheaper you buy an asset the higher its prospective return might be. However, this is frequently forgotten with investors often tempted to project recent returns into the future regardless of valuations. A valuation measure for an asset is basically a guide to whether it’s expensive or cheap. This note looks at the main issues.
It’s relatively simple for cash and bonds
An obvious example of where the starting point valuation matters critically is cash. If the interest rate on offer from a term deposit rate is low as was the case into early last year when rates were 0.5% or less then it means pretty poor returns. Recently term deposit rates have increased with the RBA cash rate and so are offering a more attractive return potential, albeit they are still down from levels around 6-7% in 2010.
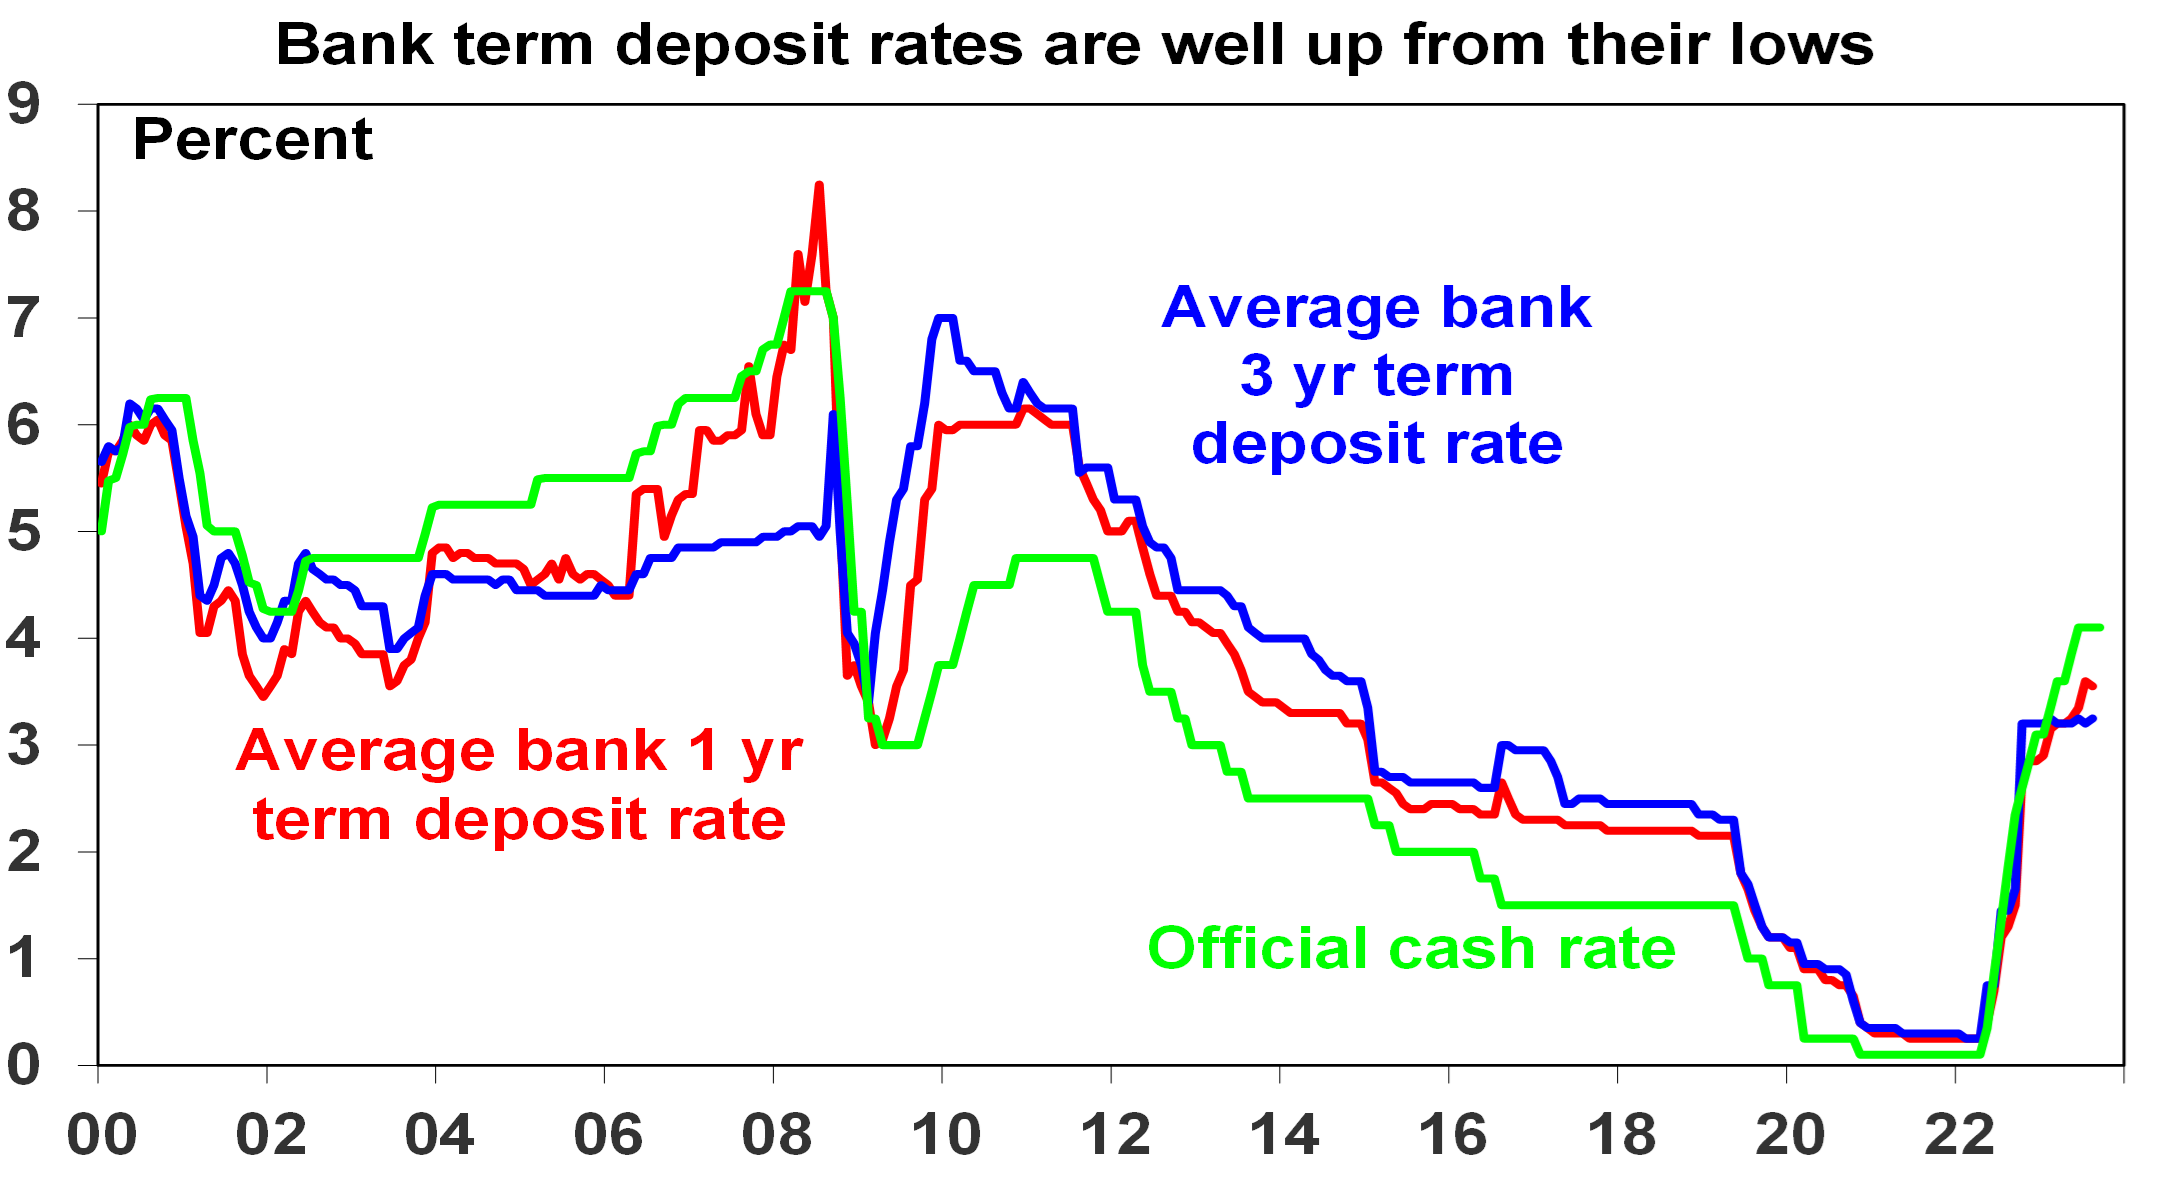
Source: RBA, AMP
For government bonds in advanced countries the yield is similarly a good guide to starting point value and hence medium-term return potential. Over short-term periods bond prices can move up and down and this influences short term returns, but over the medium term the return a bond investor will get is what bond yields were when they invested. If the yield on a 10-year bond is 5%, and you hold the bond to maturity, your return will be 5%. Of course, the relationship is not perfect but it’s a good guide. This can be seen in the next chart which shows a scatter plot of Australian 10-year bond yields since 1950 (horizontal axis) against subsequent 10 year returns from Australian bonds based on the Composite All Maturities Bond index (vertical axis).
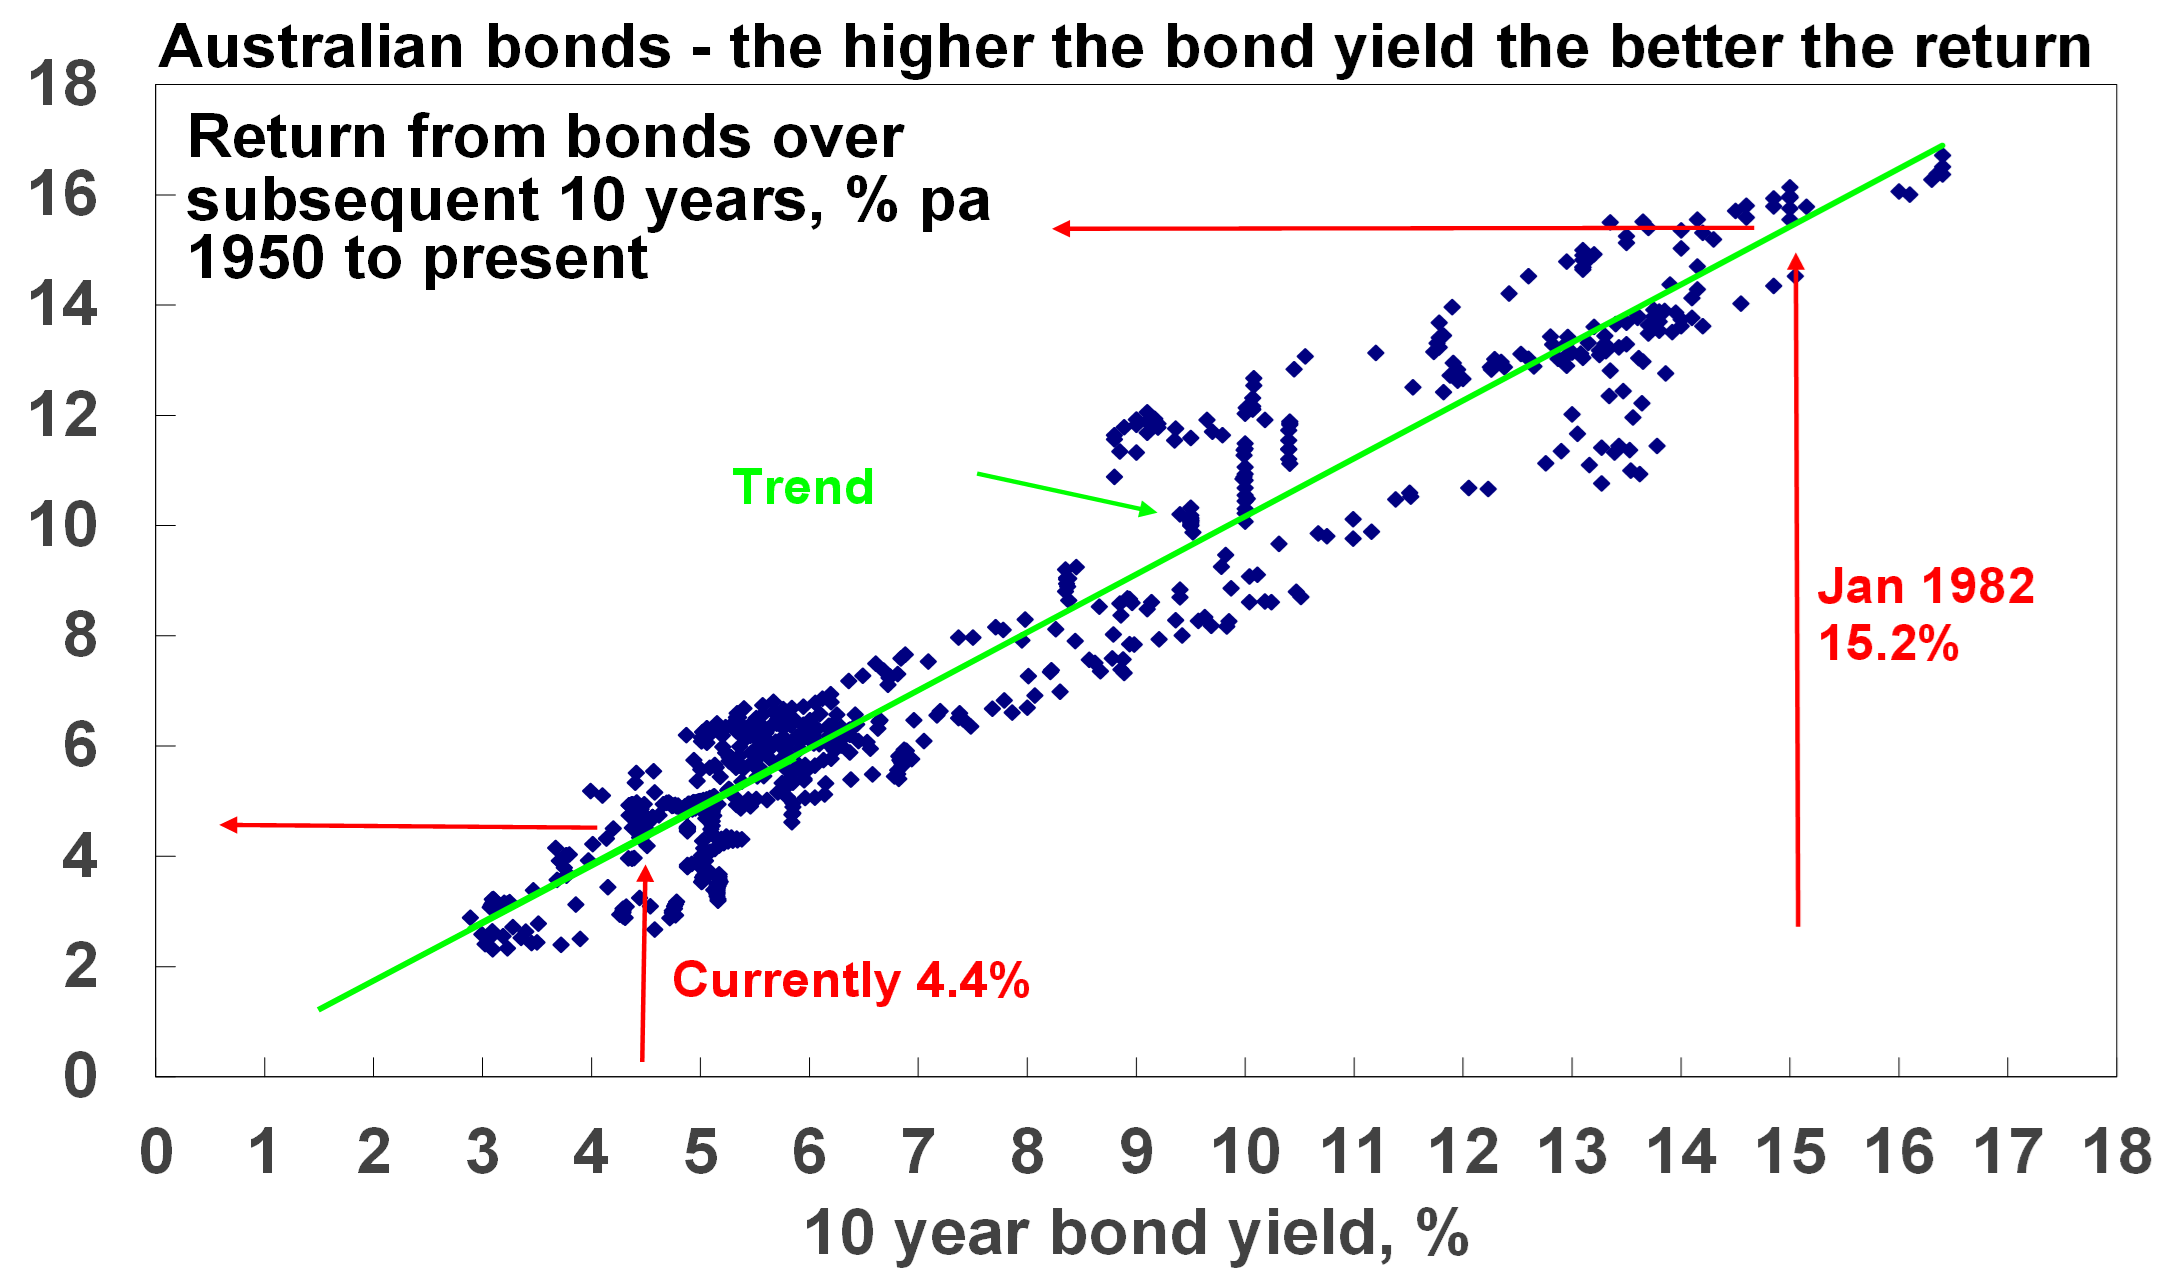
Source: Bloomberg, AMP
When bond yields are high, they set up high bond returns over the medium term and vice versa. For example, Australian 10-year bond yields in January 1982 were 15.2% and it’s not surprising that bond returns over the next 10 years were 15.4%. At their low point of 0.6% in 2020 they were pointing to very low returns but they have now increased to around 4.4% pointing to better medium term returns, albeit still historically low.
For shares a similar relationship holds. The following chart shows a scatter plot of the price to trailing 12 months earnings ratio for US shares since 1900 (along the horizontal axis) against subsequent 10-year total returns (ie, dividends plus capital growth) from US shares. While the relationship is not as smooth as that for bonds as there is much more involved in share returns, it is a negative relationship. That means when share prices are high compared to earnings, subsequent returns tend to be low and vice versa. The best time for shares is after PEs have fallen to single digits.
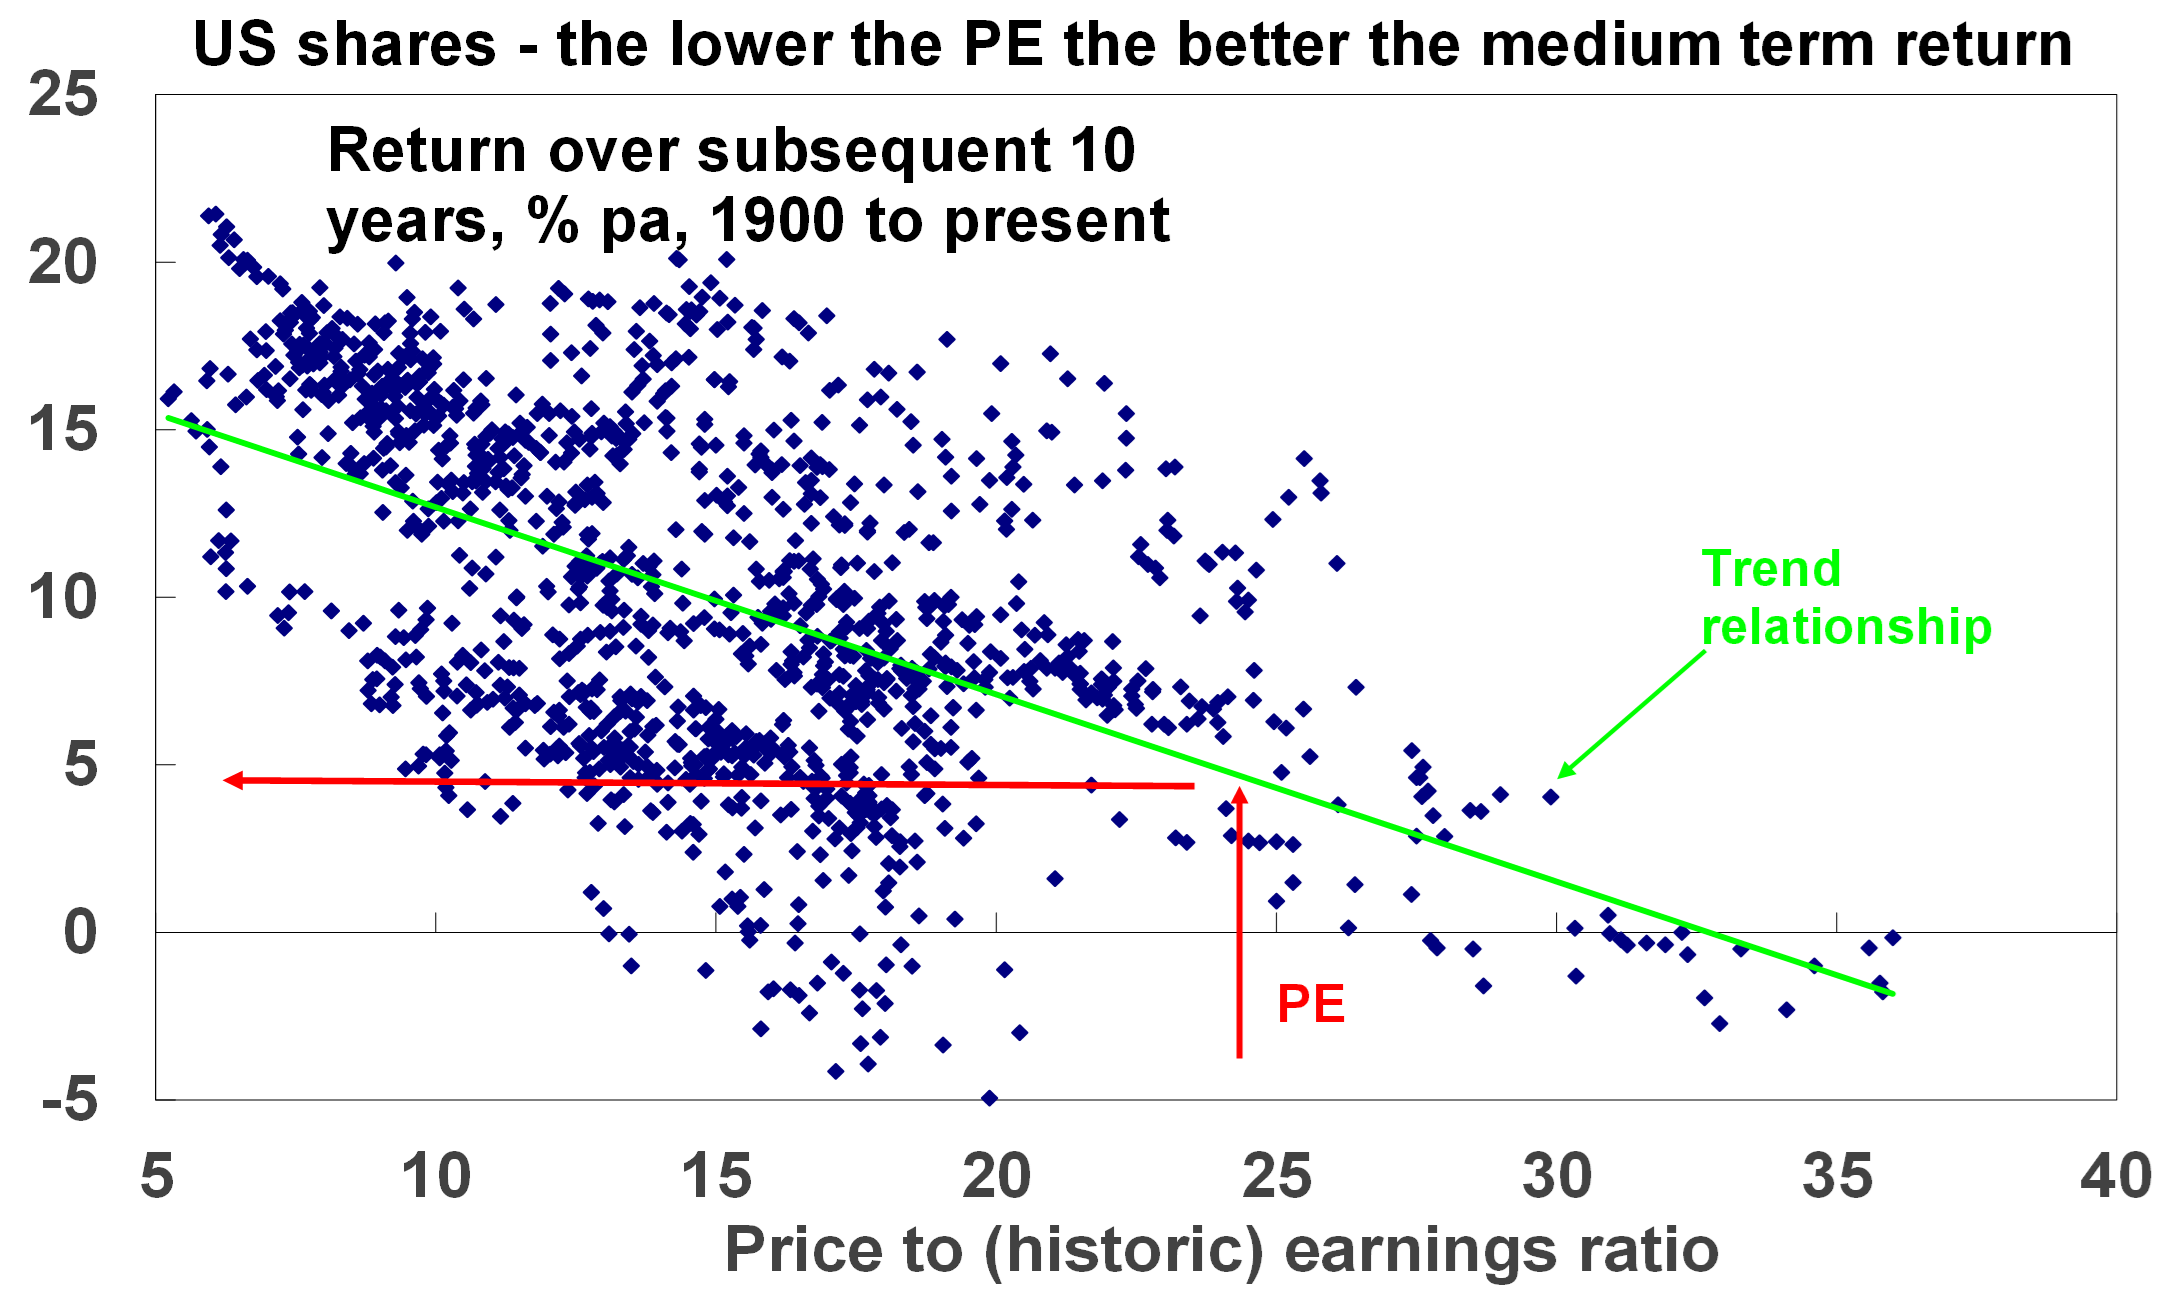
Source: Bloomberg, AMP
The next chart shows the same for Australian shares from 1962, as a PE series is not available before then. Again, there is the expected negative relationship between the level of the PE and subsequent total returns (based on the All Ords Accumulation Index) with the best returns coming after periods of low PEs. For example, at the end of the mid-1970s bear market in September 1974 the PE was just 5.4 times which was a great time to buy as Australian shares returned 21.8% pa over the next decade.
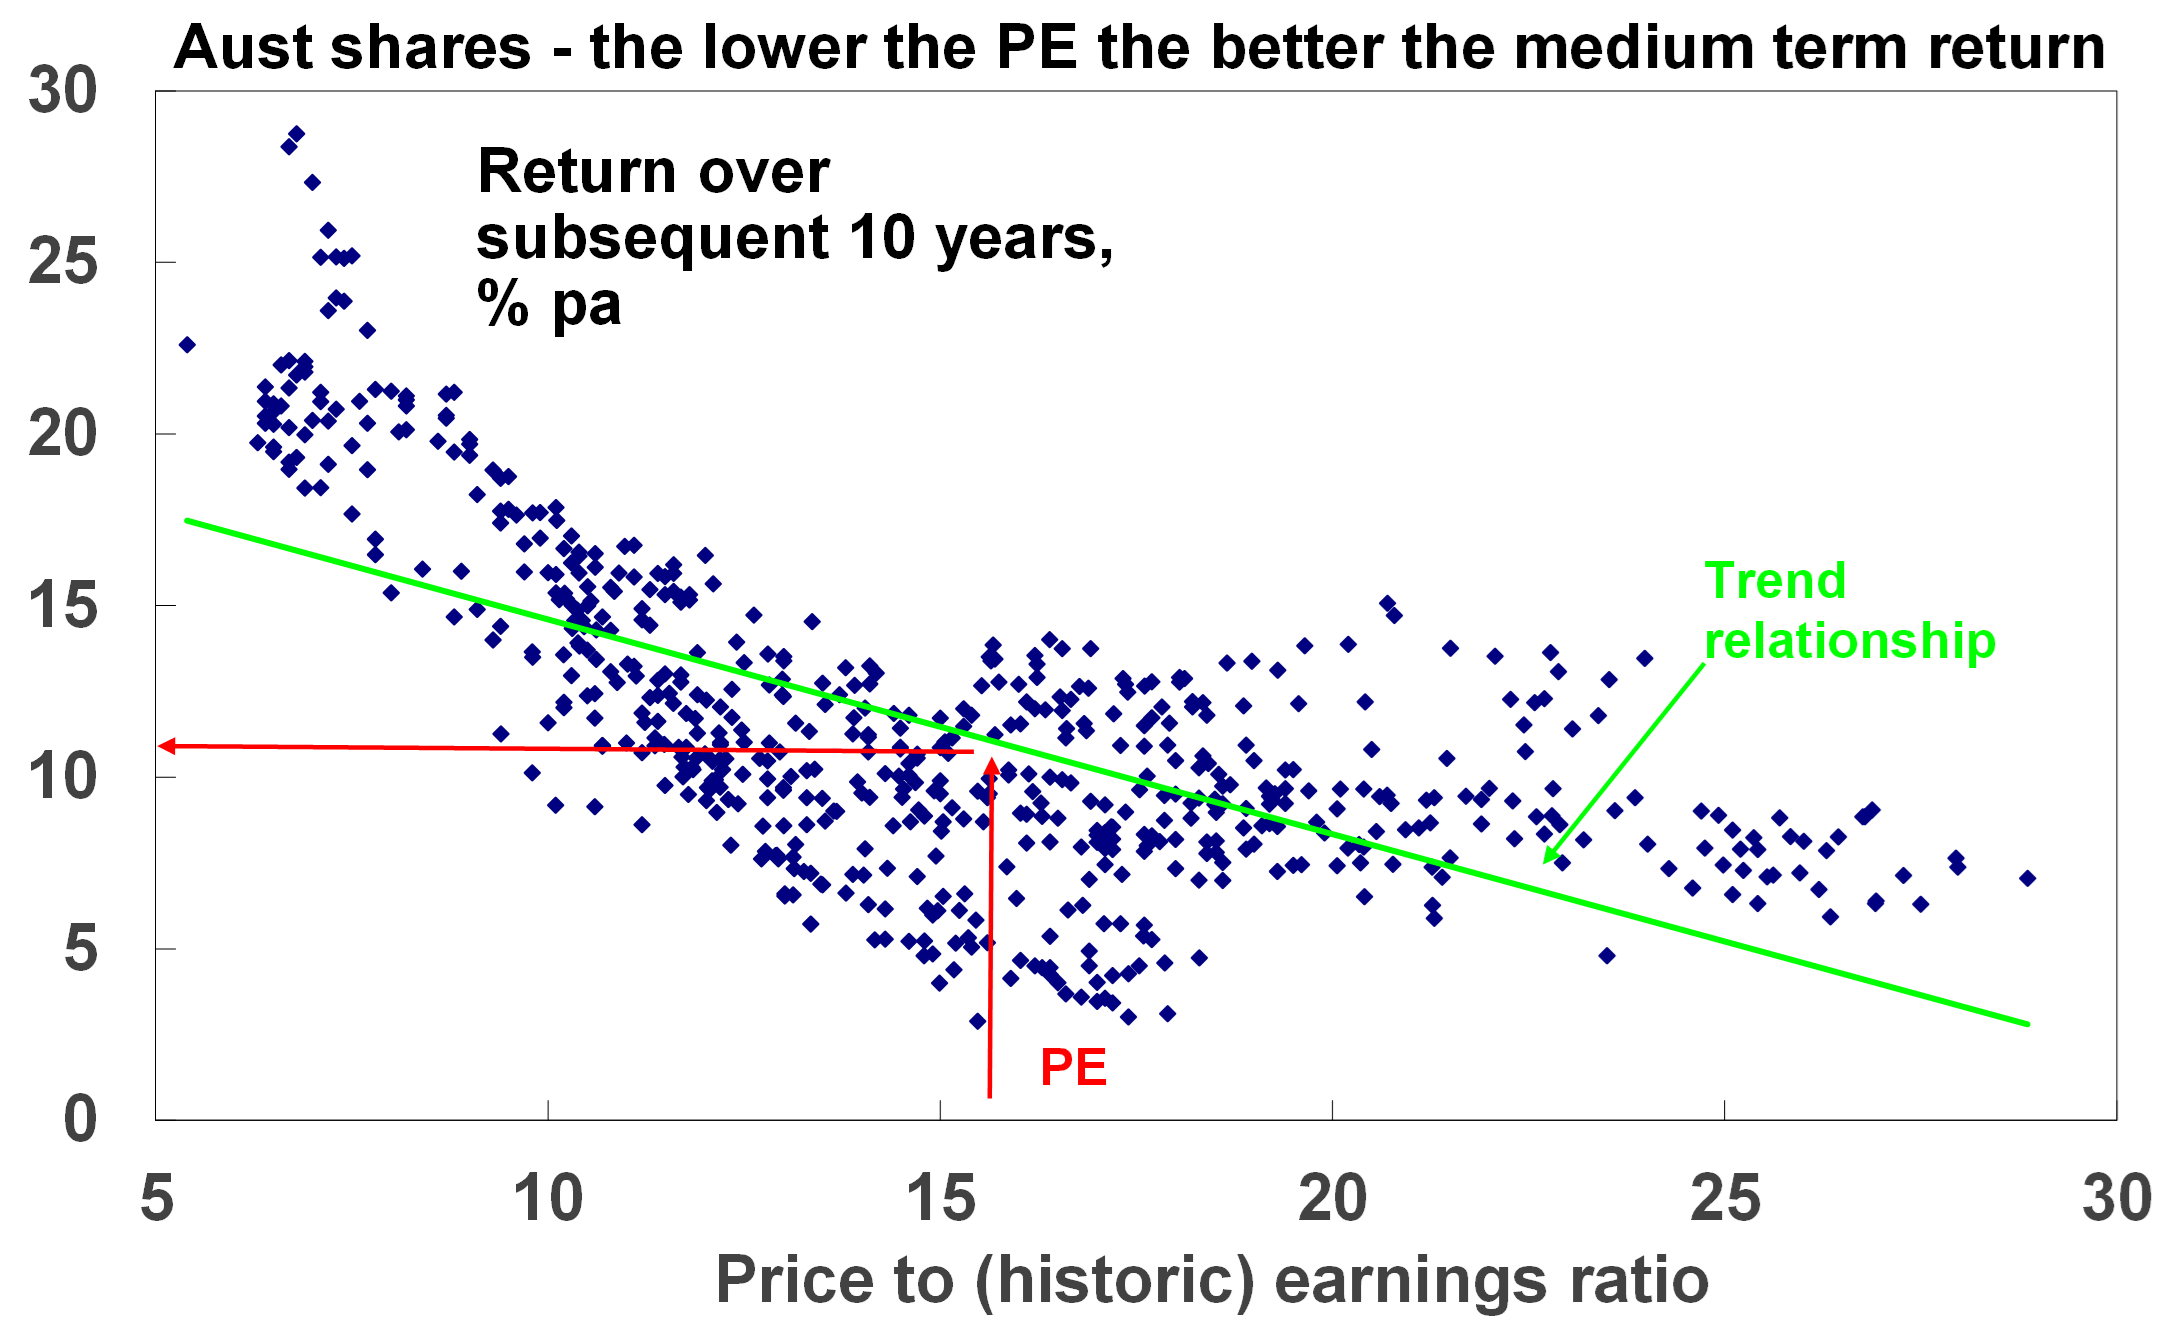
Source: RBA, ASX, AMP Capital
There is dividend yield data for Australian shares from 1900 and as expected the higher it is the better the subsequent return.
The key is that the starting point matters – put simply the higher the yield and the lower the price to earnings ratio (for shares) relative to their history the better for an asset’s medium term return potential.
Of course, valuation is not a perfect guide to returns
But the importance of starting point valuations is often forgotten. Behavioural finance tells us that it’s natural for investors to pay too much attention to recent performance, so after a run of strong years investors expect it will continue. This leads many to buy only after good times, only to find they have bought when shares are overvalued and therefore find themselves locked into poor returns. And vice versa after a run of poor returns. So, when valuations matter the most, they often get ignored. But of course, valuations can have their own pitfalls.
- First, you need to allow for risk as sometimes assets are cheap for a reason. This can be an issue with individual shares, eg, a tobacco company subject to lawsuits even though current earnings are fine.
- Second, valuation is a poor guide to market timing, often being out by years. To paraphrase John Maynard Keynes, the market can remain expensive (or cheap) for longer than you can remain solvent. For example, economist Robert Shiller’s call that US shares were exhibiting “irrational exuberance” in 1996 was four years before the tech wreck & shorting them in 1996 would have sent an investor bust.
- Third, there is a huge array of valuation measures when it comes to shares. For example, the “earnings” in the PE can be actual historic earnings as reported for the last 12 months, consensus earnings for the year ahead or earnings that have been smoothed to remove cyclical distortions. All have pros and cons. For example, the historic PE is based on actual data, but it can give the wrong signal during or after of a recession as earnings may be depressed making shares look far more expensive than they actually are.
- Finally, the appropriate level of valuation will vary with inflation and interest rates. In times of low inflation, assets can trade on lower yields as the yield structure in the economy falls, uncertainty falls and (for shares) the quality of reported earnings improves. This means higher PEs. So low inflation, say down to 2%, can be good for shares via higher PEs as seen in the next chart. The shift from the high inflation of the 1970s and 1980s to the low inflation last decade was very positive for shares. But if inflation rises resulting in higher interest rates, then shares should trade on lower PEs as investors find shares less attractive, uncertainty rises and earnings quality falls. This of course was a major factor weighing on share markets last year.
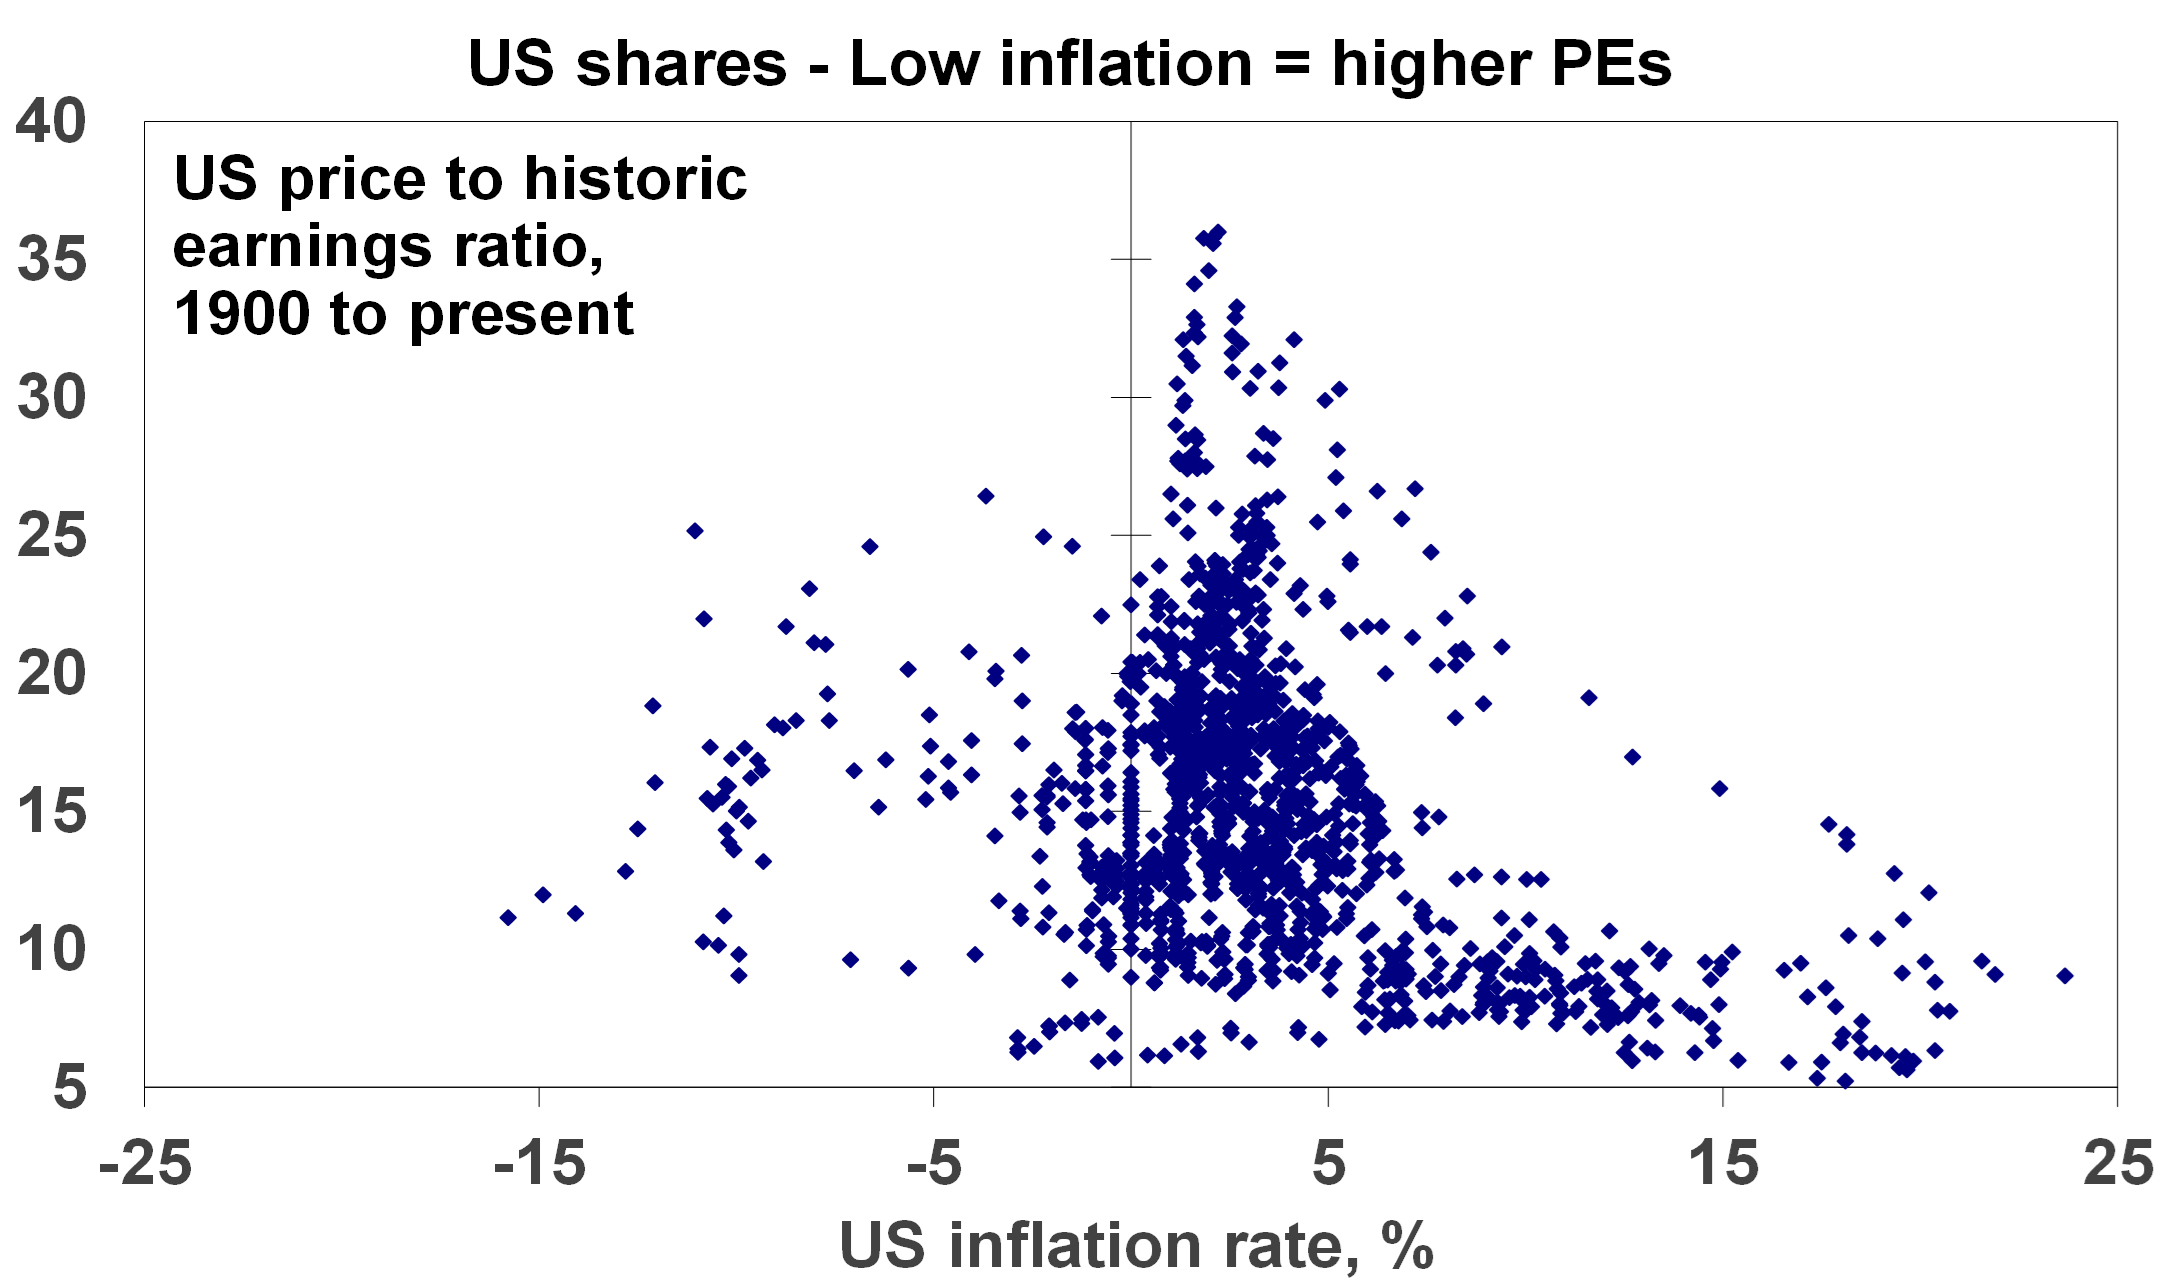
Source: Bloomberg, AMP Capital
To get technical: share prices in theory should equal the present value of future dividends discounted by the required rate of return which equals the risk-free interest rate (usually seen as government bond yields) plus a return premium to cover the higher volatility of shares. It follows from this that shares should trade on higher price to earnings ratios when interest rates fall and vice versa when they rise, all other things being equal. This is why interest rates can’t be ignored when valuing shares.
Current valuation signals
Right now, starting valuation signals are as follows:
Cash – Cash and term deposit rates at 4% or so are far more attractive than was the case two years ago but are still below the rate of inflation.
Bonds – Bond yields at 4% or more are far more attractive than was the case two years ago, pointing to much improved medium term return potential albeit it’s still constrained.
Shares – PE ratios for shares point to a medium-term return potential of around 10% for Australian shares but just 5% for US shares (see the red lines on the PE charts earlier). Allowing for the rise in bond yields – by subtracting 10-year bond yields from the earnings yields (using forward earnings) – shows US and Australian shares now offer a reduced return premium over bonds of around 0.8% in the US and 2% in Australia. See the next chart. For the US this is the lowest risk premium over bonds since after the tech wreck whereas current uncertainties (around interest rates, recession risk & geopolitics) suggest the risk premium should ideally be higher. Fortunately, that for Australian shares is more attractive. But ideally bond yields need to fall to improve the prospects for shares. If we are right and inflation continues to fall over the year ahead, then this should allow lower bond yields and provide some support to shares. But in the near term the risk of a further correction in share markets led out of the US remains high reflecting the deterioration in US share valuations particularly for tech stocks which are very sensitive to bond yields.
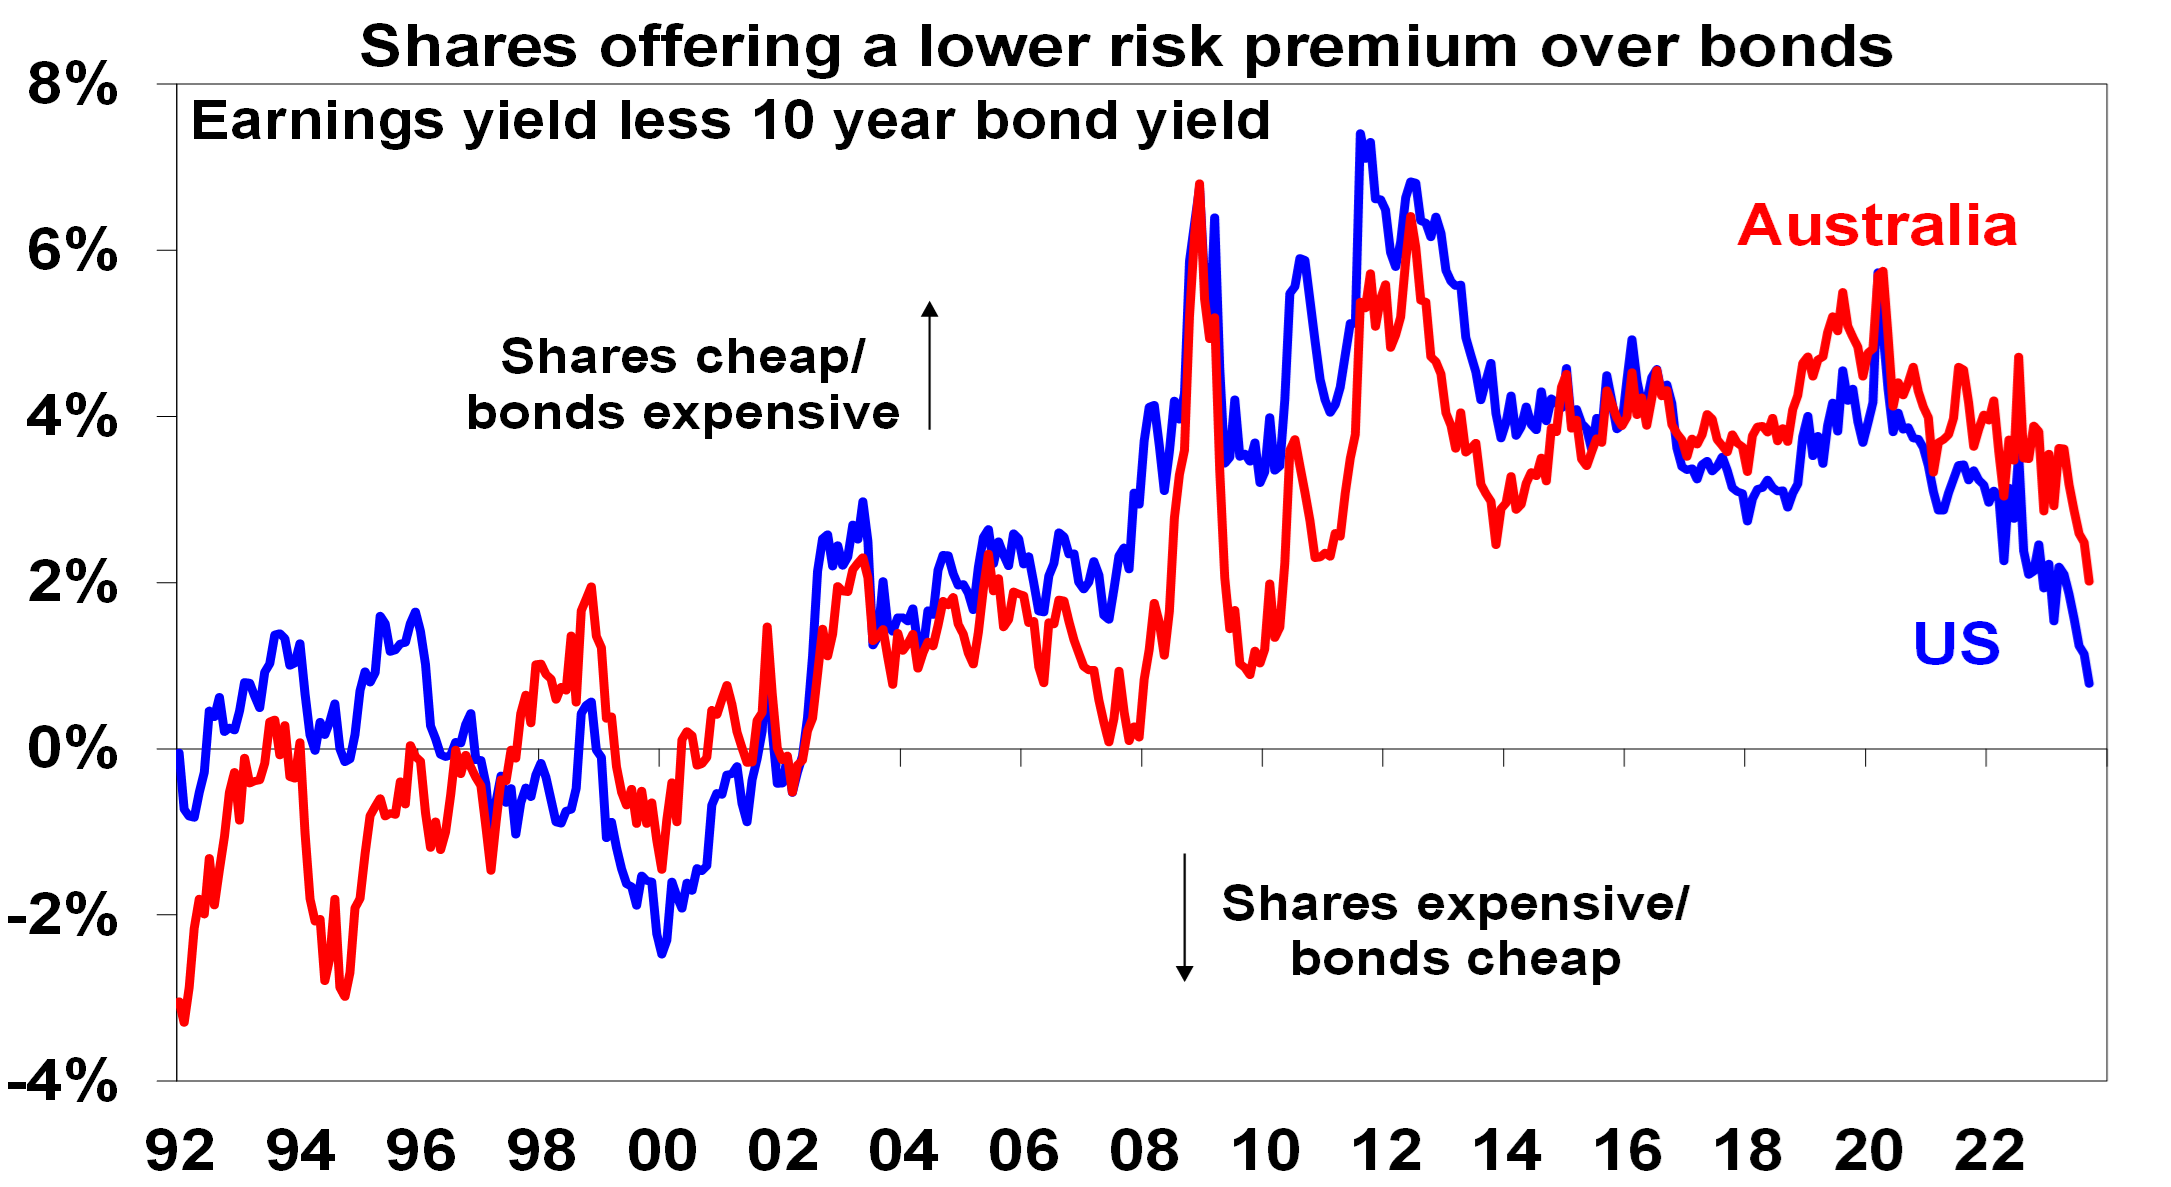
Source: Bloomberg, AMP Capital
What you need to know
While every care has been taken in the preparation of this article, neither National Mutual Funds Management Ltd (ABN 32 006 787 720, AFSL 234652) (NMFM), AMP Limited ABN 49 079 354 519 nor any other member of the AMP Group (AMP) makes any representations or warranties as to the accuracy or completeness of any statement in it including, without limitation, any forecasts. Past performance is not a reliable indicator of future performance. This document has been prepared for the purpose of providing general information, without taking account of any particular investor’s objectives, financial situation or needs. An investor should, before making any investment decisions, consider the appropriateness of the information in this document, and seek professional advice, having regard to the investor’s objectives, financial situation and needs. This article is solely for the use of the party to whom it is provided and must not be provided to any other person or entity without the express written consent AMP. This article is not intended for distribution or use in any jurisdiction where it would be contrary to applicable laws, regulations or directives and does not constitute a recommendation, offer, solicitation or invitation to invest.
The information on this page was current on the date the page was published. For up-to-date information, we refer you to the relevant product disclosure statement, target market determination and product updates available at amp.com.au.